Late-October Pacific System
4 resorts in the path, 33cm at the biggest. Likely — the models agree on this one.
+33CM
Predicted at Alyeska Resort
4–77cm, models far apart
Storm
Oct 31–Nov 3
4 resorts in the path
Peak
Nov 1
22cm at Alta
Predicted
33cm
Alyeska Resort · 4–77cm, models far apart
Confidence
Likely
Updated
Oct 29, 12:30 UTC
SnowSure Forecaster
Written from the blend and the model spread · updated Oct 29, 12:30 UTC
Current prediction: 4–77cm for Alta between 2026-10-31 and 2026-11-03, 33cm our central figure. The biggest day is 2026-11-01 at 22cm. Also in the path: Brighton 28cm, Telluride 25cm, Solitude 18cm. Confidence is likely: the models agree on both the window and the magnitude. These figures are re-read from the latest model blend; each entry in the log keeps what we said at the time.
Forecast log
Every entry, newest first. Nothing is overwritten.
- Day 3·Oct 29·Watching·41cm(-108)
Day 3: totals down 108cm, 4–75cm for Alyeska Resort
Day 3: totals down 108cm at Alyeska Resort, the window slid 1 day later, confidence moved from likely to watching, 4 dropped out. Current prediction: 4–75cm for Alyeska Resort between 2026-11-01 and 2026-11-05, 41cm our central figure. The biggest day is 2026-11-03 at 22cm. Also in the path: Wolf Creek Ski Area 38cm, Silverton 31cm, Shames Mountain 31cm. Confidence is watching: the signal has crossed our threshold but the models still disagree on how much. By resort: Likely at 1 of 4 resorts. On day one we said 191cm from 2026-10-30; that is the number we are measured against. What to watch next: whether the models hold the window, whether the low tracks closer to the core resorts, and the freezing level in the days before it arrives. 3 days to go.
Window Nov 1–5 · Alyeska Resort
- Day 2·Oct 28·Likely·149cm(-42)
Day 2: totals down 42cm, 10–318cm for Alyeska Resort
Day 2: totals down 42cm at Alyeska Resort, the window slid 1 day later, confidence moved from watching to likely, 6 resorts joined the path, 1 dropped out. Current prediction: 10–318cm for Alyeska Resort between 2026-10-31 and 2026-11-08, 149cm our central figure. The biggest day is 2026-11-05 at 39cm. Also in the path: Shames Mountain 46cm, Wolf Creek Ski Area 42cm, Silverton 36cm, and 4 more. Confidence is likely: the models agree on both the window and the magnitude. By resort: Likely at 6 of 8 resorts. On day one we said 191cm from 2026-10-30; that is the number we are measured against. What to watch next: whether the models hold the window, whether the low tracks closer to the core resorts, and the freezing level in the days before it arrives. 3 days to go.
Window Oct 31–Nov 8 · Alyeska Resort
- Day 1·Oct 27·Watching·191cmFirst prediction
Watch issued: 44–408cm for Alyeska Resort, 2026-10-30 to 2026-11-07
THE PREDICTION: 44–408cm for Alyeska Resort between 2026-10-30 and 2026-11-07, 191cm our central figure. The biggest day is 2026-10-30 at 45cm. Also in the path: Whistler Blackcomb 47cm, Wolf Creek Ski Area 33cm. We are watching a significant system for North America, 3 days out. Confidence is watching: the signal has crossed our threshold but the models still disagree on how much. By resort: Likely at 1 of 3 resorts. Resorts nearest the core of the moisture win; totals fall off away from it, and the lowest bases are the first to see rain mixed in. The prediction changes if model agreement loosens, the window slides later, or the freezing level trends higher. We will update this log every scan until the window opens.
Window Oct 30–Nov 7 · Alyeska Resort
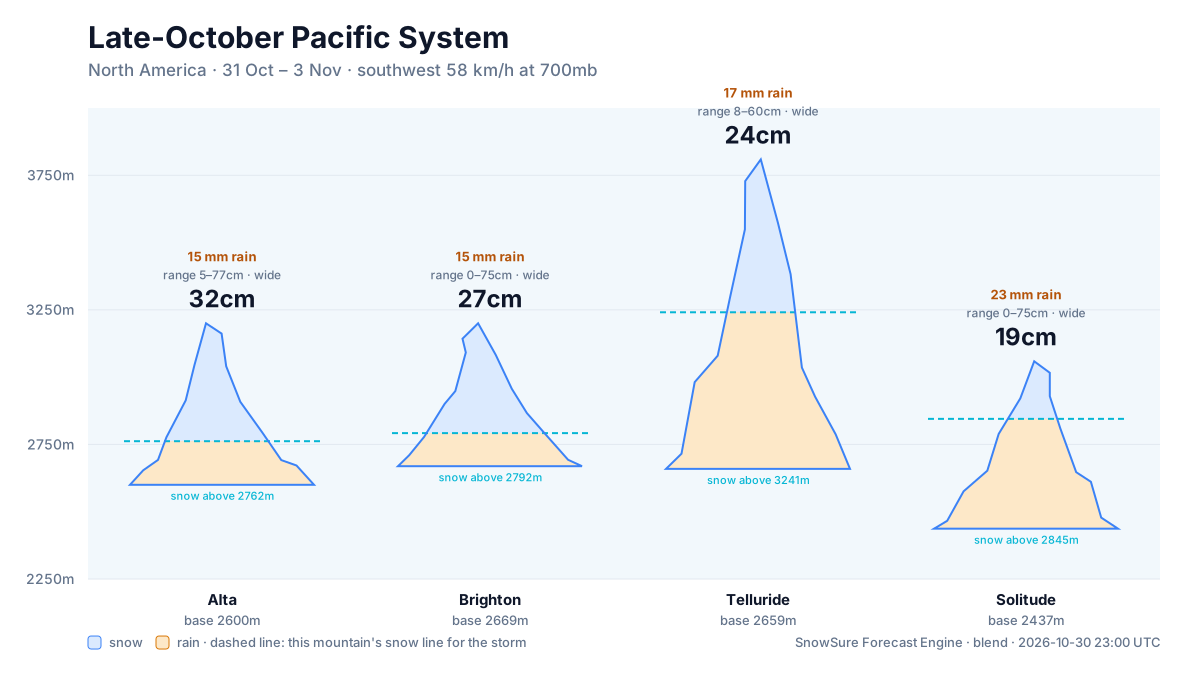
Snow by day
Oct 30 – Nov 4, with a day either side. For each resort: where the freeze line sits against the mountain, then what falls — snow in cm, rain in mm — and the day read from those two numbers.
Altabase 2,600 m · summit 3,200 m
33cm snow13mm rain
Modelled at the summit, 3,200 m · snow above 2,857 m
linem
/ raincm · mm
Fri
Oct 30
Mixed
Sat
Oct 31
Mixed
Sun
Nov 1
Mixed
Mon
Nov 2
Snow
Tue
Nov 3
Dry
Wed
Nov 4
Snow
snow Mon · rain low, snow high Sat, Sun (above about 2,857 m)
Brightonbase 2,669 m · summit 3,200 m
28cm snow14mm rain
Modelled at the summit, 3,200 m · snow above 2,846 m
linem
/ raincm · mm
Fri
Oct 30
Mixed
Sat
Oct 31
Mixed
Sun
Nov 1
Mixed
Mon
Nov 2
Snow
Tue
Nov 3
Dry
Wed
Nov 4
Snow
snow Mon · rain low, snow high Sat, Sun (above about 2,846 m)
Telluridebase 2,659 m · summit 3,809 m
25cm snow16mm rain
Modelled at the summit, 3,809 m · snow above 3,579 m
linem
/ raincm · mm
Fri
Oct 30
Dry
Sat
Oct 31
Mixed
Sun
Nov 1
Mixed
Mon
Nov 2
Snow
Tue
Nov 3
Dry
Wed
Nov 4
Snow
snow Mon · rain low, snow high Sat, Sun (above about 3,579 m)
Solitudebase 2,437 m · summit 3,059 m
18cm snow23mm rain
Modelled at the summit, 3,059 m · snow above 2,904 m
linem
/ raincm · mm
Fri
Oct 30
Rain
Sat
Oct 31
Rain
Sun
Nov 1
Mixed
Mon
Nov 2
Snow
Tue
Nov 3
Dry
Wed
Nov 4
Snow
snow Mon · rain low, snow high Sun (above about 2,904 m) · rain Sat
snowrain low, snow highraindryThe dots are the freeze line — the height where rain turns to snow. Solid: straight from the models. Hollow: estimated from temperature. Above the summit line it rains on the whole mountain; below the base line it snows all the way down. Blue bars are snow in cm, amber bars rain in mm; the totals above are their sums.
Rain / snow line
Base to summit for each mountain, with the snow line cut across them.
The system
700mb flow — where the storm is, and what is steering it. Pins sized by forecast total.
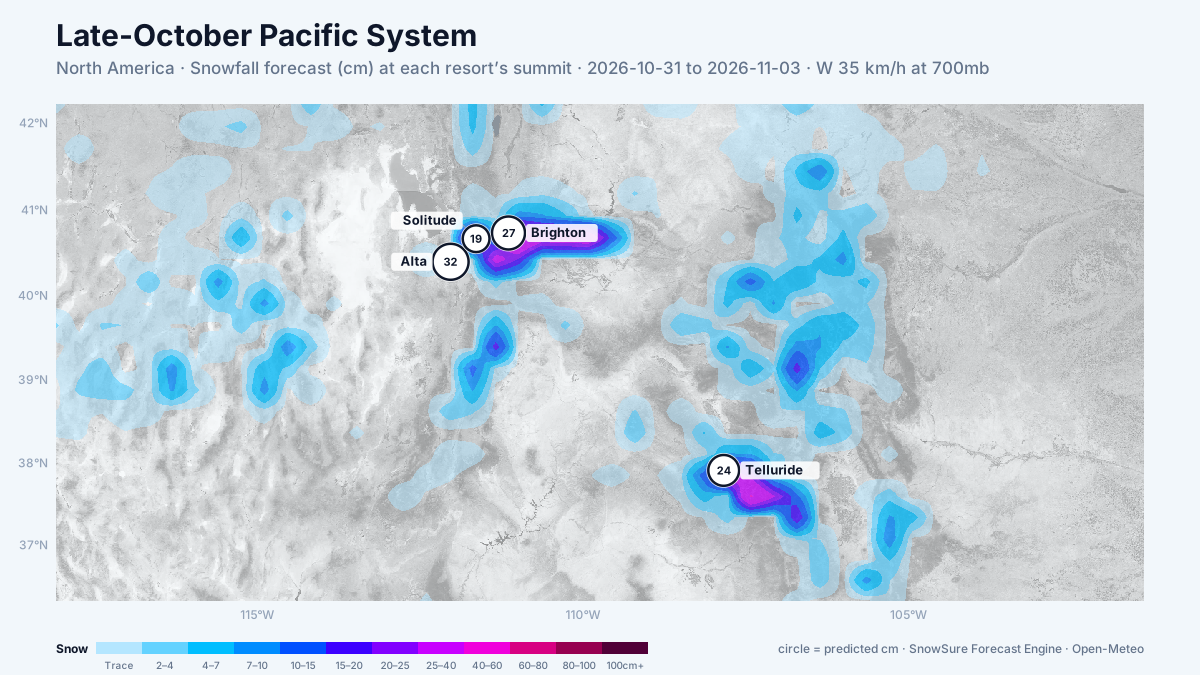
72-hour snowfall forecast for the same window.

In the path
Forecast, not observation — none of this has fallen yet. Totals are across the window. We will post what fell when the window closes.
 LiveAltabiggest day 22cm on 1 Nov · on trackPredicted33cm4–77cm, models far apart
 LiveBrightonbiggest day 20cm on 1 Nov · on trackPredicted28cm1–75cm, models far apart
LiveTelluridebiggest day 18cm on 2 Nov · newPredicted25cm9–59cm across the models
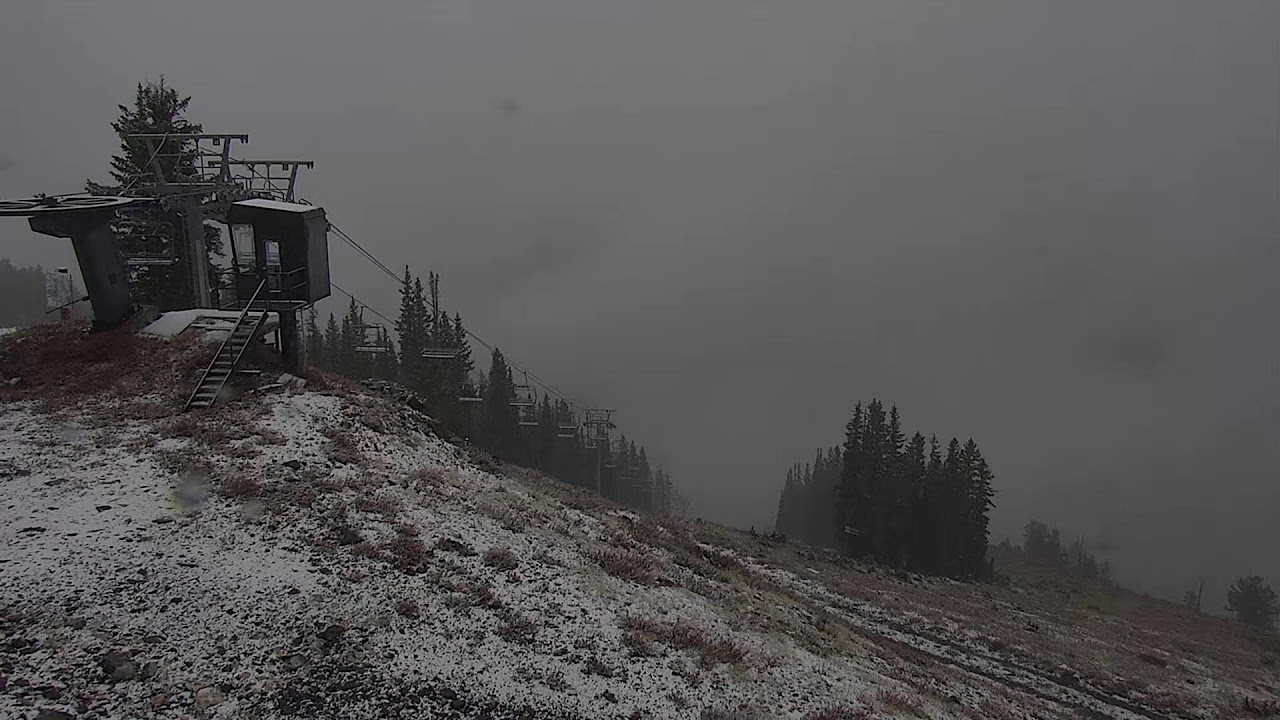 LiveSolitudebiggest day 11cm on 1 Nov · on trackPredicted18cm0–75cm, models far apart
Last updated 2026-10-28 18:30 UTC. SnowSure scans a blend of seven weather models twice daily and flags systems clearing 30cm over 72 hours, three to fourteen days out. This watch opened on 2026-10-28 with 33cm forecast at Alta.


